From a peak population of 116,662 in 2013, Peoria has seen a steady decline, with the 2022 population recorded at 111,021.
This shift highlights significant demographic trends and urban challenges faced by the city.
Despite this decline, Peoria maintains a vibrant community with a population density of 2,395.6 people per square mile.
The county’s population shifts have been sporadic, with some years even seeing minor increases, such as a 1.1% rise between 2019 and 2020.
However, the overall trend suggests a slow but steady decrease in numbers.
Analyzing these population changes offers insights into Peoria’s evolving landscape. The most recent years have shown a consistent annual drop.
Key Takeaways
Initial Settlement and Population Origins

Peoria started as a French trading post established in the late 17th century. Located along the Illinois River, it soon attracted settlers due to its strategic and fertile location. In 1813, Fort Clark was built, marking the area’s increased prominence.
Throughout the early 1800s, the population grew as European immigrants and settlers from the eastern United States moved in. Agriculture and river trade were primary draws, establishing Peoria as a critical settlement in the region.
Population Trends in the 19th Century
The development of the Illinois River corridor significantly contributed to Peoria’s population boom in the mid-19th century. The Illinois River served as a crucial transportation route, linking Peoria to other major cities and markets.
The completion of the Illinois and Michigan Canal in 1848 further enhanced this connectivity by connecting the Illinois River to Lake Michigan, facilitating easier movement of goods and people between the Mississippi River and the Great Lakes region.
As a result of these improvements in transportation infrastructure, Peoria experienced rapid population growth. According to U.S. Census data, the city’s population increased from approximately 1,619 residents in 1840 to 5,095 in 1850—an impressive growth of over 200% in just a decade.
This trend continued into the next decade, with the population reaching 14,045 by 1860. The accessibility provided by the river corridor attracted industries such as grain processing, distilleries, and manufacturing, which in turn drew workers and their families to the area.
Industrial Growth and Demographic Changes

Peoria’s industrial boom in the late 19th and early 20th centuries marked a significant era of demographic change. The establishment of large industries, such as heavy machinery manufacturing and distilleries, attracted workers from various regions and countries.
According to the U.S. Census Bureau, Peoria’s population grew dramatically during this period.
In 1880, the population was approximately 29,259, and by 1900, it had nearly doubled to 56,100, reflecting the city’s rapid industrialization.
This substantial growth was largely due to the influx of workers seeking employment in the burgeoning industries.
The city’s demographic composition became more diverse as immigrants from countries like Germany, Ireland, and Eastern Europe settled in Peoria. According to historical census data, by 1900, immigrants and their children constituted a significant portion of the population, contributing to the city’s cultural richness.
For instance, the foreign-born population made up about 15% of Peoria’s total population at the time.
The population continued to grow, reaching a peak around the mid-20th century. As reported by the Bureau, Peoria’s population peaked at 111,856 in 1950.
This growth mirrored national trends during the post-World War II era and was fueled by the city’s thriving industrial sector, including major employers like Caterpillar Inc., which established its headquarters in Peoria in 1910.
Statistical Analysis of Population Data
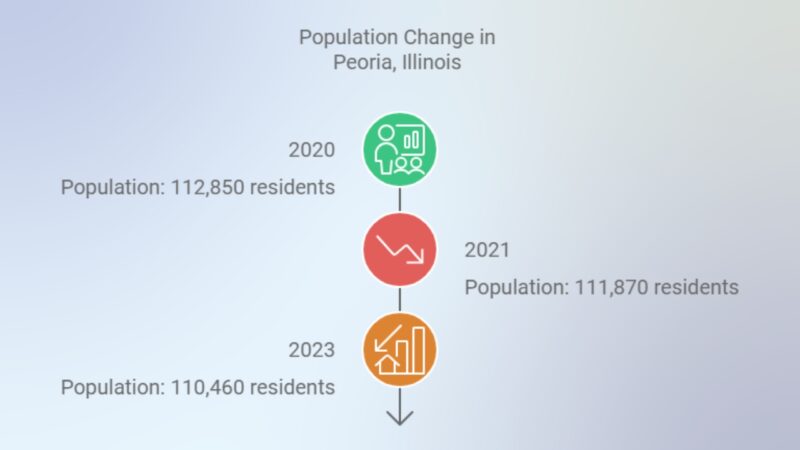
Peoria, Illinois, has seen significant changes in its population over the past two decades. The city’s population reached its peak in 2013 at 116,662 residents. However, since then, the trend has been mostly downward.
By 2020, Peoria’s population had declined to 112,850, marking the beginning of a consistent decrease in the number of residents. The decline continued in 2021, with the population falling to 111,870, a 0.87% decrease from the previous year.
By 2023, Peoria’s population further reduced to 110,460, representing a slight 0.29% year-over-year decrease from 2022 according to JournalStar.
Decadal Trends and Population Shifts (2000-2023)
When examining Peoria’s population changes over a longer period, particularly from 2000 to 2023, it becomes evident that the city has faced periods of both growth and decline. Between 2000 and 2023, Peoria’s population decreased by approximately 2,428 residents according to Neilsberg.
Despite this overall decline, Peoria did experience growth during select years. Notably, between 2019 and 2020, Peoria’s population saw an increase of 1.1%, marking a brief period of optimism. However, this growth was offset by declines in other years, with the most significant decline of 1.3% occurring between 2016 and 2017.
These population shifts reflect broader socioeconomic trends. Economic slowdowns, out-migration, and changes in industrial jobs have played a role in these fluctuations. Despite these declines, the growth in certain years indicates that Peoria can still attract new residents during times of economic stability.
Year
Population Change (%)
2016-2017
-1.3%
2019-2020
+1.1%
2000-2023
-2,428 residents
Migration Patterns and Their Impact
The city has seen a net loss of residents due to out-migration, where more people have left the city than have moved in. Between 2000 and 2022, Peoria lost approximately 1,867 residents due to out-migration.
Economic factors such as job opportunities, housing affordability, and quality of life have been key drivers behind the decision of many to leave.
In particular, Peoria’s heavy reliance on manufacturing and industrial jobs may have played a role, as the decline in these sectors has led to reduced employment opportunities.
This pattern is not unique to Peoria but reflects broader migration trends in the Midwest, where many cities face challenges in retaining residents.
Peoria County, as a whole, experienced a population growth rate of -8.12% between 1969 and 2021, which is significantly lower than the state of Illinois’ growth rate of 14.79%.
Key Points
Ethnic and Racial Population Distribution in Peoria
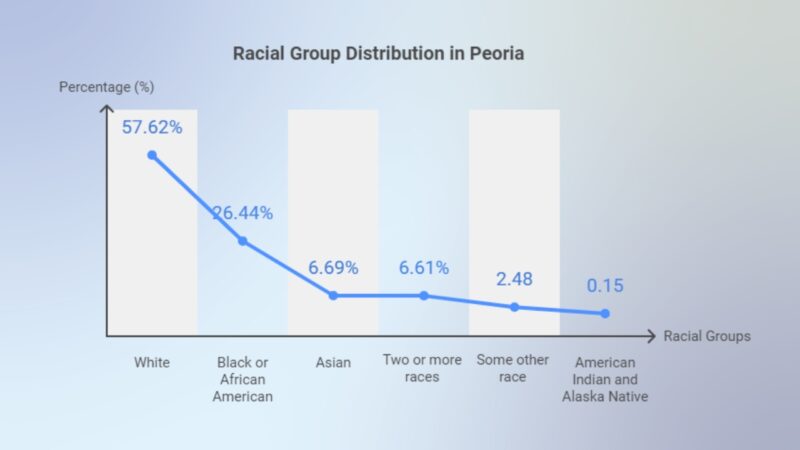
Peoria is home to a diverse population, representing multiple racial and ethnic groups. The largest racial group in the city is White, making up 57.62% of the population. The second-largest group is Black or African American residents, who account for 26.44% of the population.
Statistical atlas says that Asian individuals make up 6.69%, while those identifying as two or more races constitute 6.61% of Peoria’s population. Additionally, 2.48% of residents identify with some other race, and 0.15% are American Indian or Alaska Native.
Age and Gender Statistics
Peoria’s population is also shaped by its age and gender distribution. The median age of residents in Peoria is 40.3 years, indicating a population that leans towards middle-aged. The age distribution highlights that a substantial portion of the population falls between the ages of 25 and 54 years old, which typically represents the working-age population.
Gender distribution in Peoria is relatively balanced, with a slight majority of females. This balance reflects broader national trends where females slightly outnumber males. Seniors, aged 65 and above, also make up a significant portion of Peoria’s population, pointing to an aging demographic that requires tailored services and support.
Key Points
Household and Family Dynamics

Peoria’s household and family dynamics reveal a variety of family structures, from single-person households to multi-generational families. The median household income in Peoria is $67,718, reflecting steady economic conditions for many residents.
Educational attainment is relatively high, with approximately 89.4% of residents aged 25 and older holding at least a high school diploma.
Additionally, 34.9% of the population has a bachelor’s degree, while 14.3% possess a graduate or professional degree.
Household Statistic
Value
Median household income
$67,718
High school diploma or higher
89.4%
Bachelor’s degree
34.9%
Graduate/professional degree
14.3%
Peoria Versus Other Midwestern Cities

When comparing Peoria to other Midwestern cities, the difference in population trends becomes quite apparent. Between 2000 and 2023, Peoria’s population declined by approximately 2,428 residents. In contrast, cities like Indianapolis and Des Moines have experienced population growth during the same period.
Indianapolis has seen steady population increases, largely driven by economic diversification and significant urban development projects. These initiatives have improved job prospects and quality of life, attracting new residents. Over the same period, Indianapolis’ population grew by more than 165,000 residents.
On the other hand, Des Moines has benefited from a booming tech sector and a strong local economy, which has contributed to an increase of over 20,000 residents from 2000 to 2023.
While Peoria has experienced small population increases in certain years, it has generally faced challenges in maintaining its population. Much of this disparity can be attributed to economic shifts and a lack of job opportunities. Unlike Indianapolis and Des Moines, Peoria has not undergone the same level of economic transformation, leaving it more vulnerable to population decline.
Key Points
National Population Trends Compared to Peoria

On a national scale, the U.S. saw significant population growth between 1969 and 2021, with the population increasing by 64.88%. However, Peoria County experienced a population decline of 8.12% during the same period.
This stark contrast highlights Peoria’s divergence from national trends, as many regions across the country saw sustained growth while Peoria struggled with economic challenges and population loss.
Naperville, for instance, emerged as a growing suburb, benefiting from its proximity to Chicago and attracting new residents with its strong economy and high quality of life.
Between 2010 and 2022, Peoria County’s population decreased by an average of 0.4% per year. This stands in contrast to other regions in the U.S., which experienced more consistent growth, buoyed by job creation and economic development according to the U.S Census.
- National growth (1969-2021): +64.88%
- Peoria County decline (1969-2021): -8.12%
- Peoria County annual decrease (2010-2022): 0.4% per year
